Elliott Wave Theory, developed by Ralph Nelson Elliott in the 1930s, is a popular technical analysis tool used to analyze price movements in financial markets. While initially applied to traditional markets such as stocks and commodities, Elliott Wave Theory has also found its place in the world of cryptocurrencies. With the growing popularity of digital assets and the dynamic nature of crypto markets, understanding and effectively applying Elliott Wave Theory can provide traders with valuable insights for decision-making. In this article, we will explore how Elliott Wave Theory can be utilized in crypto trading, examining its principles and guidelines within the context of digital currencies. By leveraging this powerful analytical tool, traders can potentially enhance their understanding of market dynamics and make more informed trading decisions in the volatile realm of cryptocurrencies.
What is Elliott Wave Theory?
Elliott Wave Theory is a technical analysis tool used in financial markets to analyze and forecast price movements. It was developed by Ralph Nelson Elliot in the 1930s and is based on the premise that market prices follow specific patterns and cycles.
The theory suggests that financial markets, such as stocks, commodities, or currencies, move in repetitive wave-like patterns. These patterns are composed of a combination of upward and downward price swings, representing the psychology of market participants. According to Elliot, these waves are influenced by human emotions, such as fear and greed, which drive buying and selling decisions.
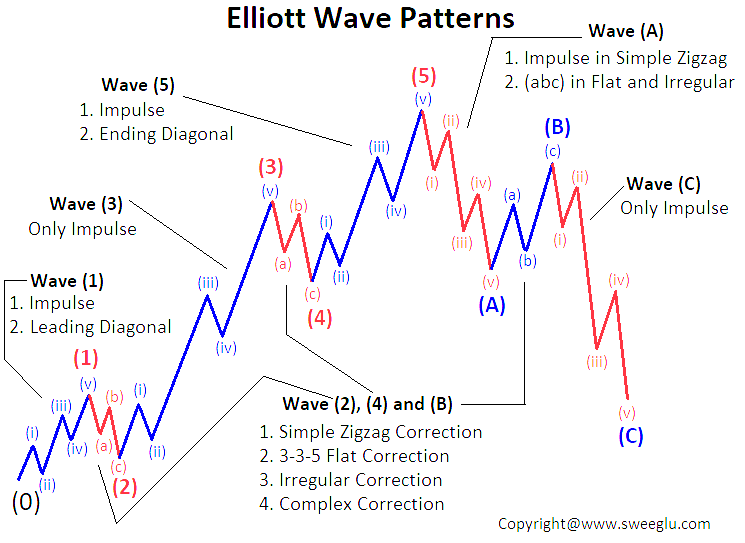
The Elliott Wave Theory consists of two main types of waves: impulse waves and corrective waves. Impulse waves, also known as motive waves, move in the direction of the main trend and are divided into five smaller waves labeled 1, 2, 3, 4, and 5. Waves 1, 3, and 5 represent upward price movements, while waves 2 and 4 are corrective waves, representing temporary pullbacks or corrections.
After the completion of an impulse wave, a corrective wave follows. Corrective waves are labeled A, B, and C and move against the direction of the main trend. Wave A is a counter-trend move, wave B is a corrective wave that partially retraces wave A, and wave C is the final leg of the correction, which usually brings prices back in line with the main trend.

Furthermore, the Elliott Wave Theory introduces the concept of wave degrees, which assign different timeframes to waves. The highest degree is known as the Grand Supercycle, followed by the Supercycle, Cycle, Primary, Intermediate, Minor, Minute, Minuette, and Sub-Minuette waves. Each degree represents a smaller or larger wave within the overall market structure.
Elliott Wave Theory is also accompanied by various guidelines and rules to help analysts identify and interpret wave patterns. For example, wave 2 typically does not retrace more than 100% of wave 1, wave 3 is usually the longest and most powerful wave, and wave 4 often retraces around 38.2% of wave 3.
While Elliott Wave Theory has gained popularity among technical analysts, it is important to note that its application can be subjective, and there is no guarantee of accuracy in predicting market movements. It requires a deep understanding of wave patterns, experience, and careful analysis to apply the theory effectively.
What are Impulse waves and Corrective waves?
Impulse Waves and Corrective Waves are the two main types of waves identified in Elliott Wave Theory. We’ve already mentioned them above so now let’s try to understand each type in more detail:
Impulse Waves
Impulse waves, also known as motive waves, are the primary directional moves in the market that follow the overall trend. They represent the larger price movements in the direction of the prevailing trend. Impulse waves are composed of five smaller waves labeled as 1, 2, 3, 4, and 5.
- Wave 1: Wave 1 is the initial move in the direction of the trend. It often occurs after a period of consolidation or correction and represents the first surge of buying or selling pressure.
- Wave 2: Wave 2 is a corrective wave that follows the completion of wave 1. It represents a partial retracement of the price movement from wave 1. Wave 2 is typically a counter-trend move and does not retrace more than 100% of wave 1.
- Wave 3: Wave 3 is usually the strongest and longest wave within the impulse wave structure. It represents the most significant surge in buying or selling pressure. Wave 3 often extends beyond the high or low of wave 1 and is considered the backbone of the entire impulse wave.
- Wave 4: Wave 4 is a corrective wave that follows the completion of wave 3. It represents a partial retracement of the price movement from wave 3. Wave 4 typically retraces around 38.2% of wave 3 and can take the form of a sideways consolidation or a more complex correction pattern.
- Wave 5: Wave 5 is the final wave of the impulse wave structure. It represents the last surge of buying or selling pressure before a potential reversal or larger correction. Wave 5 is often accompanied by divergence in technical indicators, indicating potential exhaustion of the trend.
Corrective Waves
Corrective waves, as the name suggests, are waves that move against the direction of the prevailing trend. They represent temporary price corrections or consolidations within the larger trend. Corrective waves are labeled as A, B, and C.
- Wave A: Wave A is a counter-trend move that occurs after the completion of an impulse wave. It is the first leg of the corrective structure and moves against the prevailing trend. Wave A retraces a portion of the preceding impulse wave.
- Wave B: Wave B is a corrective wave that follows wave A. It represents a partial retracement of wave A but does not surpass the start of wave A. Wave B often takes the form of a sideways or complex correction pattern and can confuse traders as it appears to be a reversal.
- Wave C: Wave C is the final leg of the corrective wave structure. It moves in the direction opposite to wave A and represents the completion of the correction. Wave C often extends beyond the end of wave A and can be the most powerful and decisive wave within the corrective structure.
Corrective waves aim to correct the price excesses created by the preceding impulse waves before the overall trend resumes. It’s important to note that corrective waves can vary in complexity and duration, and they provide opportunities for traders to enter or add to positions in the direction of the larger trend.
Understanding the interplay between impulse waves and corrective waves is essential in Elliott Wave analysis to identify potential entry points, anticipate trend reversals, and set price targets.
How Can You Use Elliott Wave Theory in Crypto Trading?
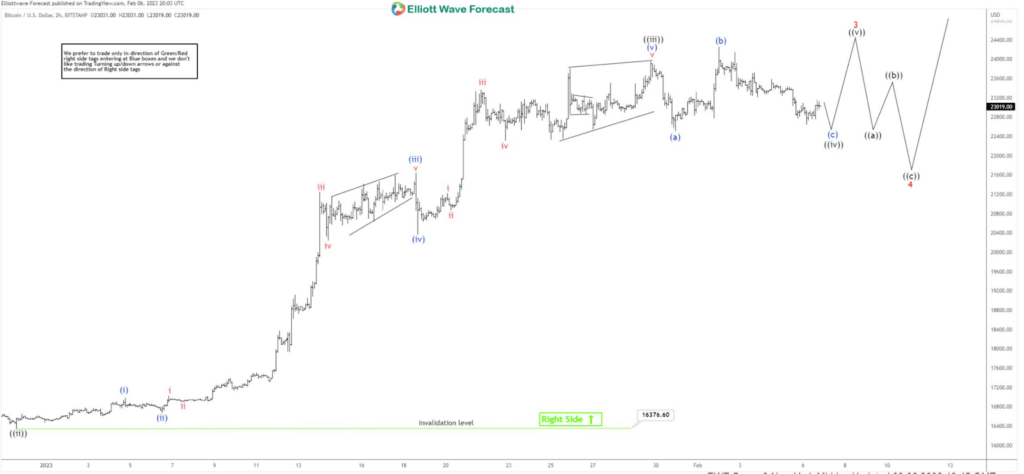
Elliott Wave Theory can be applied to crypto trading in a similar way to other financial markets. Here are some steps to effectively use Elliott Wave Theory in crypto trading, along with an example:
- Identify the Trend: Start by identifying the overall trend in the cryptocurrency you are trading. Determine whether it is in a bullish (upward) trend or a bearish (downward) trend. This can be done by analyzing the price chart and considering factors such as higher highs and higher lows for an uptrend, or lower highs and lower lows for a downtrend.
- Conduct Wave Analysis: Once the trend is established, begin wave analysis to identify impulse waves and corrective waves. Look for the formation of five-wave impulse patterns in the direction of the trend, as well as three-wave corrective patterns against the trend. Label each wave accordingly.
- Confirm Wave Counts: It’s crucial to confirm the validity of your wave counts using various technical indicators and oscillators. For example, you can utilize momentum indicators like the Relative Strength Index (RSI) or Moving Average Convergence Divergence (MACD) to assess the strength of each wave and potential divergence signals.
- Use Fibonacci Retracement: Fibonacci retracement levels can be employed to identify potential price targets and support/resistance levels within the wave structure. These levels are derived from the Fibonacci sequence and ratios, such as 38.2%, 50%, and 61.8%. They can help determine areas where price might reverse or consolidate during corrective waves.
- Apply Wave Guidelines and Rules: Utilize the guidelines and rules provided by Elliott Wave Theory to validate your wave analysis. These guidelines include the relationships between wave degrees and specific wave retracement levels. For example, wave two should not retrace more than 100% of wave one, and wave four often retraces around 38.2% of wave three.

7 Ways To Make Elliot Wave Theory Even More Effective
To apply Elliott Wave Theory more effectively in crypto trading, you can consider the following strategies and combine it with other analysis tools:
- Combine with Technical Indicators: Integrating Elliott Wave Theory with other technical indicators can provide additional confirmation and enhance the accuracy of your analysis. For example, you can use oscillators like the Relative Strength Index (RSI), Moving Average Convergence Divergence (MACD), or Stochastic Oscillator to identify overbought or oversold conditions that align with wave patterns.
- Use Support and Resistance Levels: Incorporate support and resistance levels identified through horizontal or trendline analysis with Elliott Wave Theory. These levels can act as potential reversal points or areas where price is likely to consolidate, aligning with wave patterns.
- Harmonic Patterns: Harmonic patterns, such as the Gartley, Bat, or Butterfly patterns, can be combined with Elliott Wave Theory to provide additional confluence. Harmonic patterns help identify potential reversal zones and provide price targets that align with Elliott Wave counts.
- Fibonacci Retracement and Extensions: Apply Fibonacci retracement and extension levels to identify potential price reversal zones and targets within the wave structure. Fibonacci levels can act as key support and resistance areas and provide insights into the potential depth of corrective waves or the extent of impulse waves.
- Time Analysis: Consider time analysis by observing the duration of different waves. Use time-based tools, such as Gann’s Square of Nine or Fibonacci time zones, to identify potential turning points or the duration of upcoming waves. Combining time analysis with wave counts can help fine-tune entry and exit points.
- Fundamental Analysis: While Elliott Wave Theory is primarily a technical analysis tool, it can be complemented with fundamental analysis. Fundamental factors, such as news events, project developments, regulatory changes, or market sentiment, can provide additional context to support or challenge the wave analysis.
- Practice and Experience: Like any trading strategy, practice and experience are vital to effectively apply Elliott Wave Theory. Study historical charts, practice wave counting, and analyze past price patterns to improve your ability to identify and interpret waves accurately.
Conclusion
In the fast-paced and ever-evolving world of cryptocurrencies, having a robust analytical framework is essential for traders seeking to navigate the complex market dynamics. Elliott Wave Theory offers a systematic approach to analyzing price movements, allowing traders to identify patterns and trends within the crypto market. By understanding impulse waves and corrective waves, applying wave degrees, and adhering to the guidelines and rules of Elliott Wave Theory, traders can gain a deeper insight into market psychology and anticipate potential price movements. However, it is important to remember that no trading strategy is foolproof, and Elliott Wave analysis should be used in conjunction with other technical and fundamental analysis tools, as well as sound risk management practices. With diligent practice and experience, incorporating Elliott Wave Theory into crypto trading strategies can provide traders with a valuable edge and contribute to more informed decision-making in the exciting and dynamic world of digital currencies.
FAQ
What is the Elliott wave theory?
Elliott Wave Theory is a method of analyzing financial markets that suggests price movements follow repetitive patterns or waves, helping traders predict future market trends based on historical price data.
Does Elliot wave work on crypto?
Yes, you can apply Elliott Wave Theory in crypto trading by combining it with technical indicators, support and resistance levels, harmonic patterns, Fibonacci analysis, time analysis, fundamental analysis, and gaining experience.
