What is technical analysis, which phase is it currently going through, and does it work in crypto? Let’s find out!
What is technical analysis?
According to John J. Murphy, a technical analyst with over forty years of market experience and an author of multiple textbooks on technical analysis, technical analysis is the study of market action, primarily through the use of charts, for the purpose of forecasting future price trends. Technical analysis is often set in opposition to fundamental analysis. The latter focuses on the economic forces of supply and demand that cause prices to move higher, lower or stay the same. Any fundamentalist will most likely tell you that in the science of price prediction, the cause of market movement is more important than its effect. But a technician will argue that the effect is all that matters. In crypto trading, of course, there’s a lot of overlap since every new coin has to be studied from the regulatory and technological point of view – but it’s a separate topic, let’s first deal with basic concepts.
The philosophy of technical analysis is based on three premises:
- Market action discounts everything: The technician believes that anything that can possibly affect the price – fundamentally, politically, psychologically, or otherwise, – is actually already reflected in the price of that market.
- Prices move in trends: The whole purpose of charting the price action of a market is to identify trends in early stages of their development for the purpose of trading in the direction of those trends.
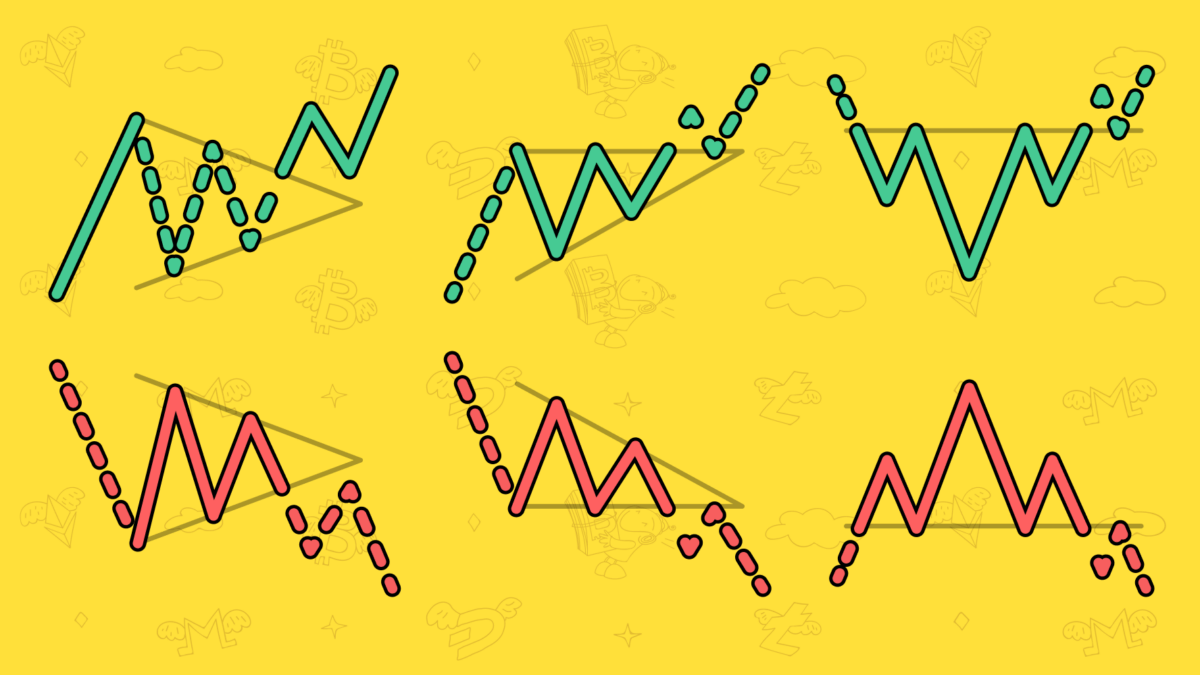
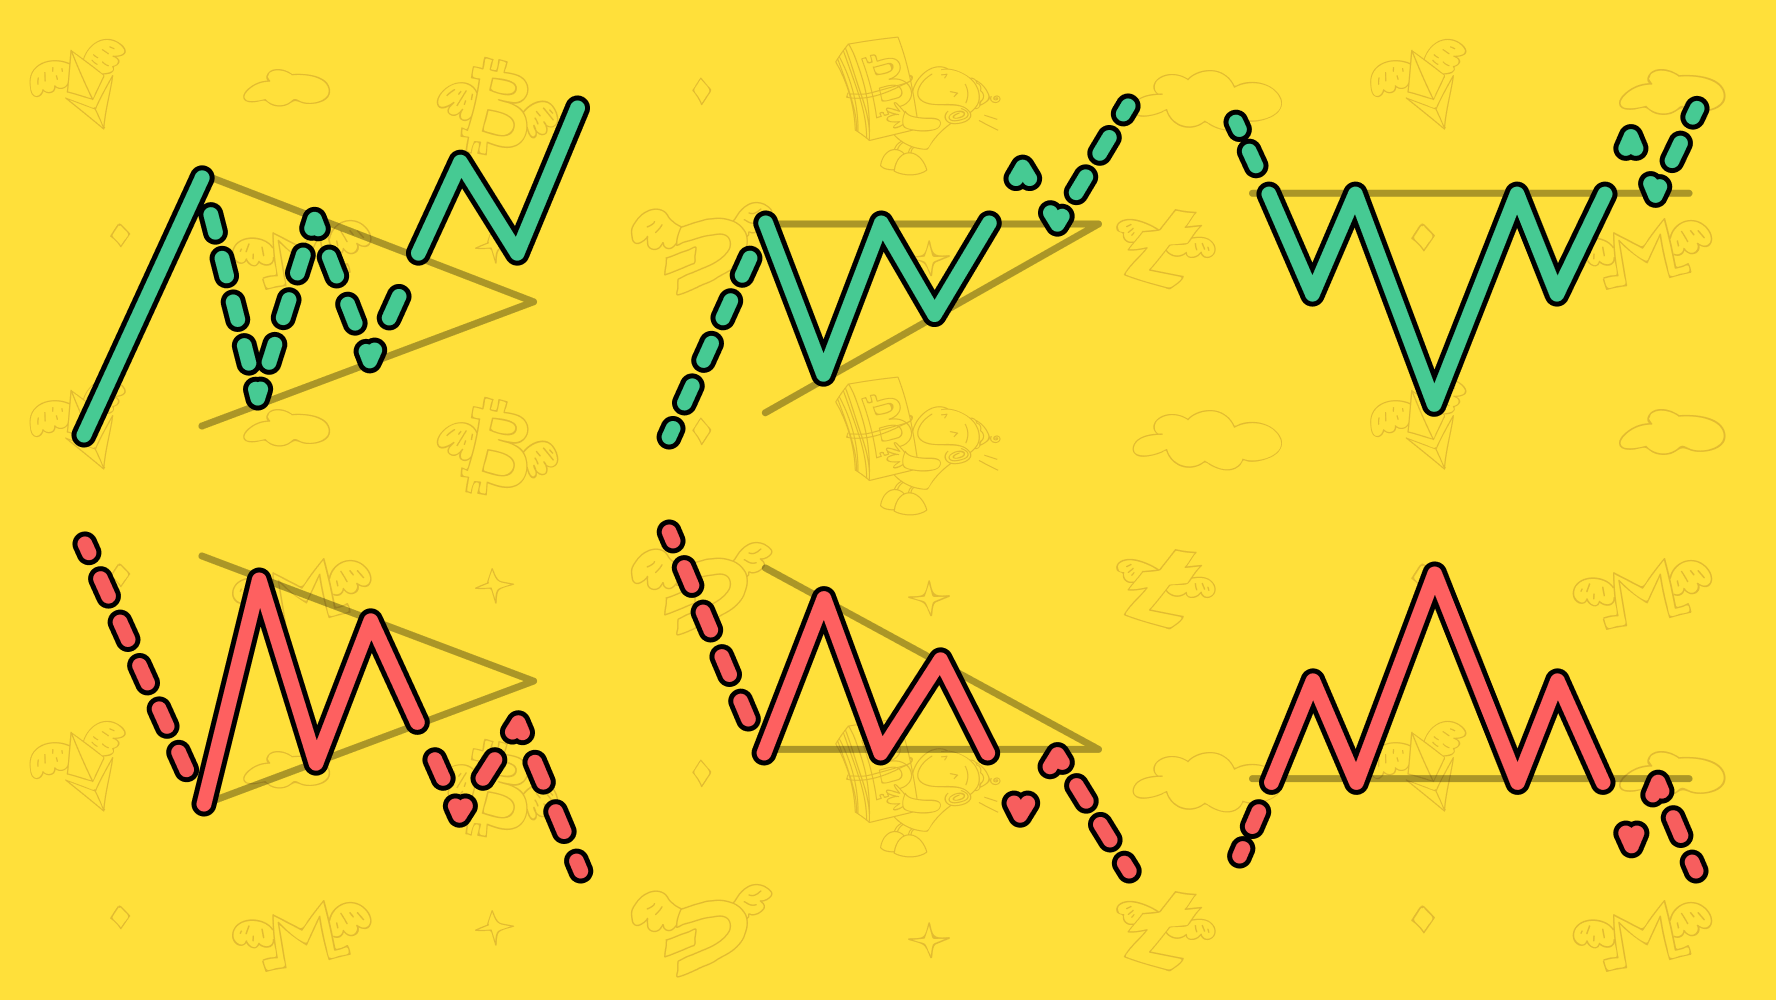
- History repeats itself: Chart patterns that have been identified and categorized over the past one hundred years reflect certain pictures that appear on price charts. Since these patterns have worked well in the past, it is assumed that they will continue to work well in the future.
The opponents of technical analysis often criticize this approach, and their criticism is mainly the following.
First of all, technical analysis might work as a self-fulfilling prophecy, which is an event that is caused only by the preceding prediction or expectation that it was going to occur. The critics often say that tools of technical analysis, such as MACD, Bollinger Bands etc, are only right because the crowd believes in them and, thus, moves the market in the direction they believe in – the predicted direction.
The second is the question of whether or not past price data can be really used to predict a future price trend. There’s a whole theory called Random Walk Theory that considers technical analysis undependable for a myriad of reasons. And one of those reasons is that technical analysis results in chartists only buying or selling a security after a move has occurred. This theory, interestingly, condemns fundamental analysis, too, due to the often-poor quality of information collected and its ability to be misinterpreted.
Also, there’s an argument that the algorithms very quickly exhaust the trend by working signals from technical indicators, thus, slower players simply don’t have time to jump on board. And that might be a strong con for crypto, where the share of the independent traders is still significant, however, the number of algos is growing. There are such companies as TradeSanta, providing user-friendly algorithms accessible for everybody, or high-frequency trading houses, such as Jump Trading, DRW, DV Trading and Hehmeye, that entered the niche back in 2017, according to Financial Times.
It should be noted, though, that with no reports on an exact amount of HFTs and algos used in crypto, as of 2022, it’s hard to conclude if algorithms in the digital-currency niche play a role significant enough to quickly work the trend shown on the charts.
Commenting on the question, Matt Weidle, a casual crypto trader, said that the pattern’s alpha is gradually eroded as more and more traders become aware of it and begin trying to predict the behavior of those who came before them.
Which phase is technical analysis currently going through in the stock market?
As a science of price prediction technical analysis was first showcased by Charles Dow and the Dow Theory in the late 1800s. So, as you can see, it has quite a track record. Where is technical analysis now, though, and what phase is it going through? Let’s investigate to see if the Dow Theory is still relevant.
In his book “Technical Analysis of the Financial Markets”, John J. Murphy notes that most technicians today recognize and assimilate Dow’s basic ideas, and Dow Theory still forms the cornerstone of the study of technical analysis, even in the face of today’s sophisticated computer technology, and the proliferation of newer and supposedly better technical indicators.
Let’s take a look at the very basic tenets of the Dow Theory:
- The averages discount everything: the markets reflect every possible knowable factor that affects overall supply and demand and assimilate effects of all the events into the price action.
- The market has three trends: primary, secondary, minor, which can be compared to the tide, waves, and the ripples of the sea. Think of a chart and trends on the chart, and you will see that if each successive wave reaches further inland than the preceding one, the tide is flowing in.
- Major trends have three phases: (1) the accumulation phase where astute investors perform informed buying; (2) public participation phase where most technical trend followers begin to participate; (3) the distribution phase where most media begin to publish bullish stories.
- The averages must confirm each other: referring to Industrial and Rail Averages, Dow mentioned that no important bull or bear market signal could take place unless both averages gave the same signal.
- Volume must confirm the trend: Dow recognized volume as a secondary but important factor in confirming price signals. He thought that in a major uptrend, it would increase as prices move higher. In downtrends, volume should decrease as prices drop.
- A trend is assumed to be in effect until it gives definite signals that it has reversed: it’s difficult for many technicians to distinguish between a normal secondary correction and the first leg of a new trend. But a number of technical tools, such as support and resistance, trend lines and moving averages, are available, and it’s more than possible.
If the basic premises of the Dow Theory are still relevant, the Dow Jones Industrial Average (DJIA) Charles Dow created in 1896 is a matter of controversy. Being one of the oldest and most commonly followed equity indices, it is considered by some professionals hopelessly archaic and an inadequate representation of the overall U.S. stock market compared to a broader market index such as the S&P 500. Compiled out of 30 large companies, DJIA is a price-weighted index. That contrasts with many stock indices using market capitalization.
All things considered, technical analysis still heavily relies on the principles developed many years ago, however, the discipline evolves. For example, the method of constructing indices is not the same as the one Dow used when working on his articles in the end of the 19th century.
Will technical analysis in crypto grow into the same mature phase as in traditional markets?
Technical analysis is a discipline that can be applied to any market, cryptocurrency including.
As a tool, you can use this method in the same vein across different products, however, you should consider the specifics of crypto trading and adjust your approach depending on what you work with. Take a look.
The first major difference between traditional finance and cryptocurrency markets is that crypto markets are much more volatile. You already know that volatile instruments are considered to be more risky than non-volatile instruments, but they might potentially bring bigger returns. So your job here is to learn how to work with these unorthodox markets that might maximize your gains. The choice of appropriate volatility indicators might be vital: Donchian Channels, Keltner Channel, Relative volatility, Chaikin volatility, Bollinger Bands, and other volatility indicators work best with crypto markets.
For example, Bollinger Bands can be applied for monitoring so-called breakouts. Keltner Channels place bands around developing prices in order to gauge volatility and assist directional prediction. Donchian Channels construct upper, lower, and mid-range bands through examination of price extremes over the chosen time period, and so on. Chaikin volatility generates an oscillator that applies Moving Average Convergence Divergence (MACD) to accumulation-distribution rather than price.
“Technical indicators may need to be interpreted differently in a volatile market compared to a trending or flat market. You may be inclined to look for reversals at the extremes due to volatility,” says Bram Jansen, a casual crypto trader and a chief editor & co-founder of VPNAlert, “or you might look at daily ranges to exploit moves in shorter time frames. As the market begins to trend in one direction or another, this point may be where you start to look for a shift in the market’s behavior.” Jansen also mentions that here you can add risk, pyramid positions and boost trailing stops as the market progresses in a trending pattern. In range bound markets, traders may limit their exposure while exploring potential breaks to either the upside or the downside while keeping a close eye on volume.
The second characteristic of the crypto market in terms of technical analysis results from a never-ending volatility of digital assets. A lot of crypto traders use technical analysis on much shorter time-frames than those who trade forex or stocks.
“It is frequently used to locate short-term trades (typically two weeks to one month),” says Mark Blakey, a casual crypto trader, “it is not utilized to find chances for long-term investment.”
Also, crypto markets have less of a price history to work with compared to stocks. This correlation might be very important when predicting market and price behavior through the lens of mathematical and statistical modeling. Algorithms, prevailing in the traditional markets, make better decisions if the historical data is larger.
However, in crypto, the trading volume is still not high enough for individual investors to buy HFT black boxes in bulk and compete with other individual investors. Although more and more individual traders use trading bots, like TradeSanta, for algorithms to use signals from technical indicators and enter and exit 24/7 at the most appropriate times.
All in all, as a method, technical analysis doesn’t differ from market to market. You just need to learn how to work with these unorthodox markets to maximize your gains. Technical analysis works better with stock markets since the historical data is larger, however, automated trading strategies in crypto put you ahead of your competitors if you use those strategies.
Conclusion
Technical analysis studies market action, primarily through the use of charts, for the purpose of forecasting future price trends. The philosophy of technical analysis is based on three premises: (1) market action discounts everything; (2) prices move in trends; (3) history repeats itself.
Currently, technical analysis still heavily relies on the Dow Theory which proclaims a few principles working when using technical analysis for any market, crypto including: (1) the averages discount everything, (2) the market has three trends, (3) major trends have three phases, (4) the averages must confirm each other, (5) volume must confirm the trend, (6) a trend is assumed to be in effect until it gives definite signals that it has reversed.
As a tool, you can use technical analysis in the same vein across different products, however, you should consider the specifics of crypto trading and choose the appropriate technical indicators, such as Relative volatility, Chaikin volatility, Bollinger Bands. Also, in crypto, you can use automated trading strategies, as in TradeSanta, that work based on technical indicators’ signals day and night and propel you over your potential competitors – other individual traders like you.
FAQ
Does technical analysis work on cryptocurrency?
Technical analysis is a discipline that can be applied to any market, cryptocurrency including. As a tool, you can use this method in the same vein across different products, however, you should consider the specifics of crypto trading and adjust your approach depending on what you work with.
Which technical analysis is best for cryptocurrency?
For example, Bollinger Bands can be applied for monitoring so-called breakouts. Keltner Channels place bands around developing prices in order to gauge volatility and assist directional prediction. Donchian Channels construct upper, lower, and mid-range bands through examination of price extremes over the chosen time period,