Trend indicators are used to define whether there price of a traditional or crypto asset is steadily heading in a particular direction or the price movements occur without any particular trend. Trend is a key term for cryptocurrency traders. Before entering a position a trader should determine whether the position he’s about to open is in accordance with crypto market’s tendencies.
How does trend correspond to price movements? Simply speaking, if the price is moving up, the trend is called bullish or uptrend. If the price of cryptocurrency is falling, a bearish trend or downtrend is observed. The absence of an apparent trend is called sideways trend. In today’s article we’ll explore the most important indicators used to determine a trend.
Trend lines
The fastest way to determine a trend of Bitcoin or any other crypto is drawing a trend line. Connect asset’s highs and lows and look at the picture. If a new high is higher than the previous high and the line is heading up, you’re looking at the example of a rising trend. If the crypto asset’s latest lows are below the previous lows, the coin or equity is experiencing a downtrend. Read more about trend lines and how to make use of them in our article about support and resistance.
Simple Moving Averages
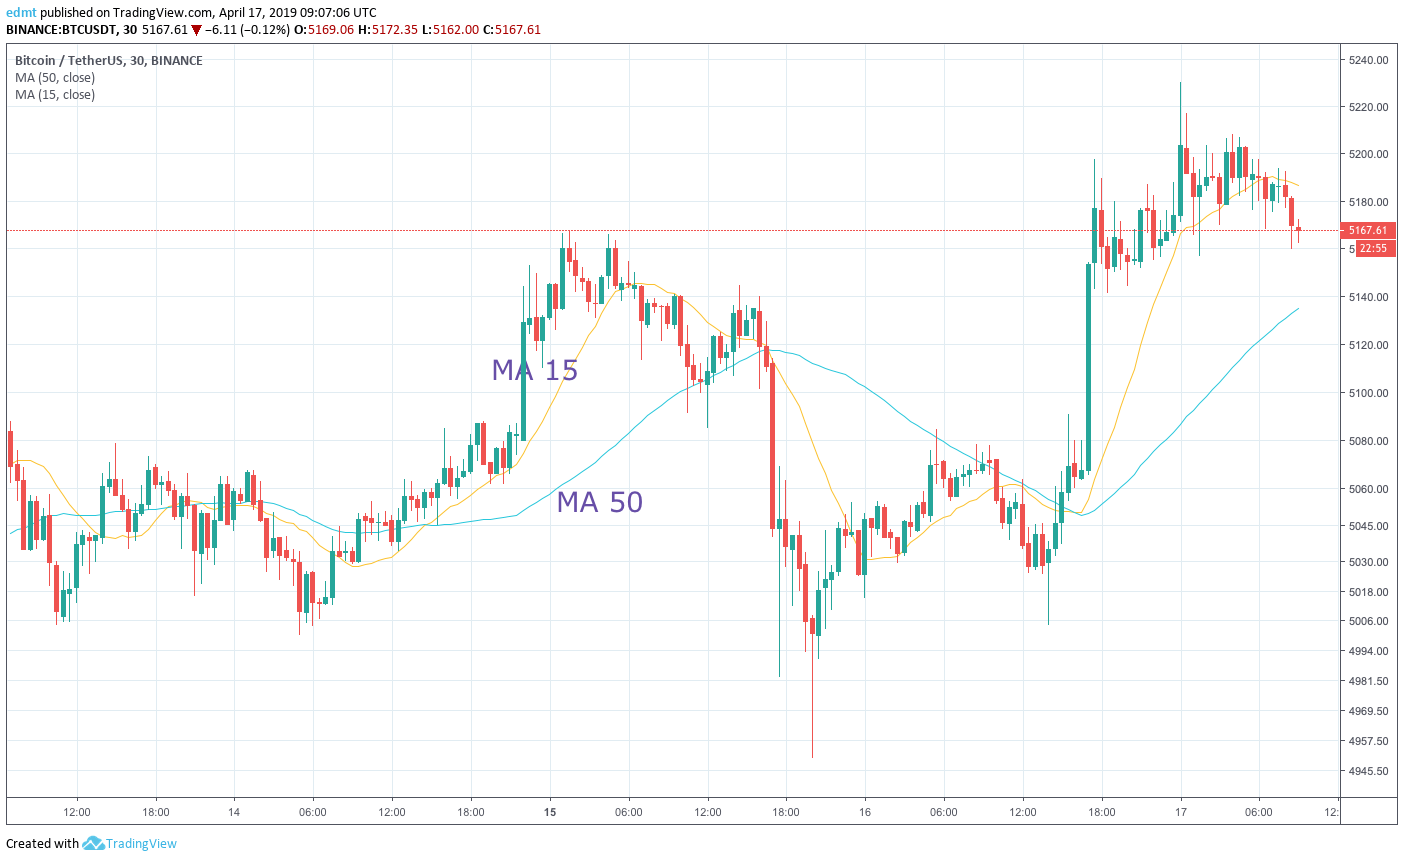
Simple Moving Averages (SMA) may help a trader to spot a trend. To do that, plot on a chart two moving averages – long-term and short-term ones (traders usually combine MA of 200 and 50 or 50 and 15 periods). Moving averages are usually built based on closing cryptocurrency price of a period, but they can be also calculated with opening or intraday prices.
If a short term Simple Moving Average crosses long-term line above, it serves as a sign of a bullish trend and entry signal for traders. On the contrary, crossing slower SMA below is considered a bearish signal and a start of a downtrend.
MACD
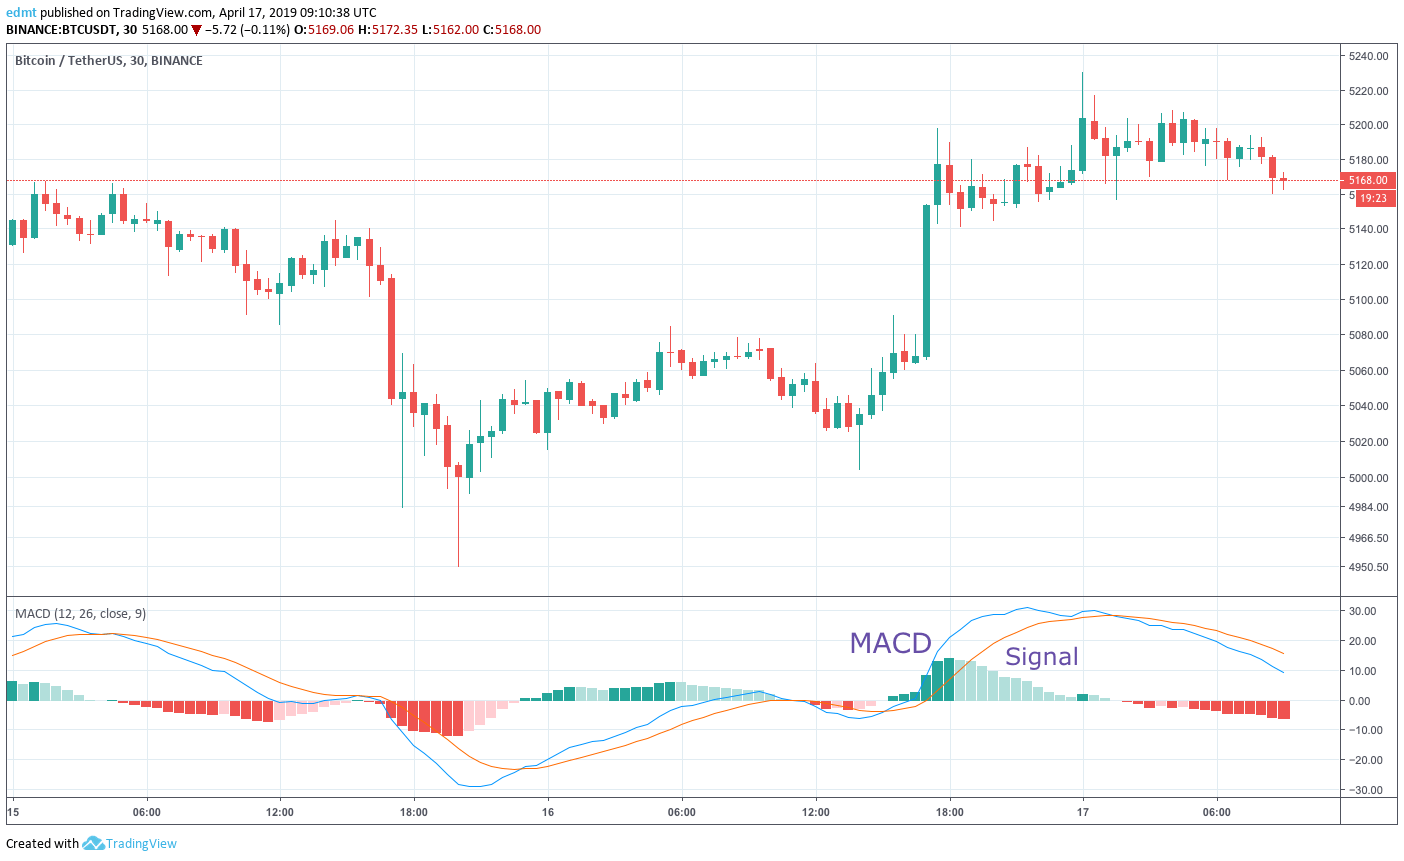
A crossover principle similar to SMA is used to define a trend with Moving Average Convergence Divergence (MACD). MACD line is calculated by subtracting 26-period Exponential Moving Average (EMA) from 12-period EMA. The EMA is calculated in a way that more weight is given to the recent prices. To identify a trend of cryptocurrency a second line is used. It’s called signal line and represents a 9-period EMA’s.
When MACD crosses the signal line above bullish trend is to expect and vice versa.
Parabolic SAR
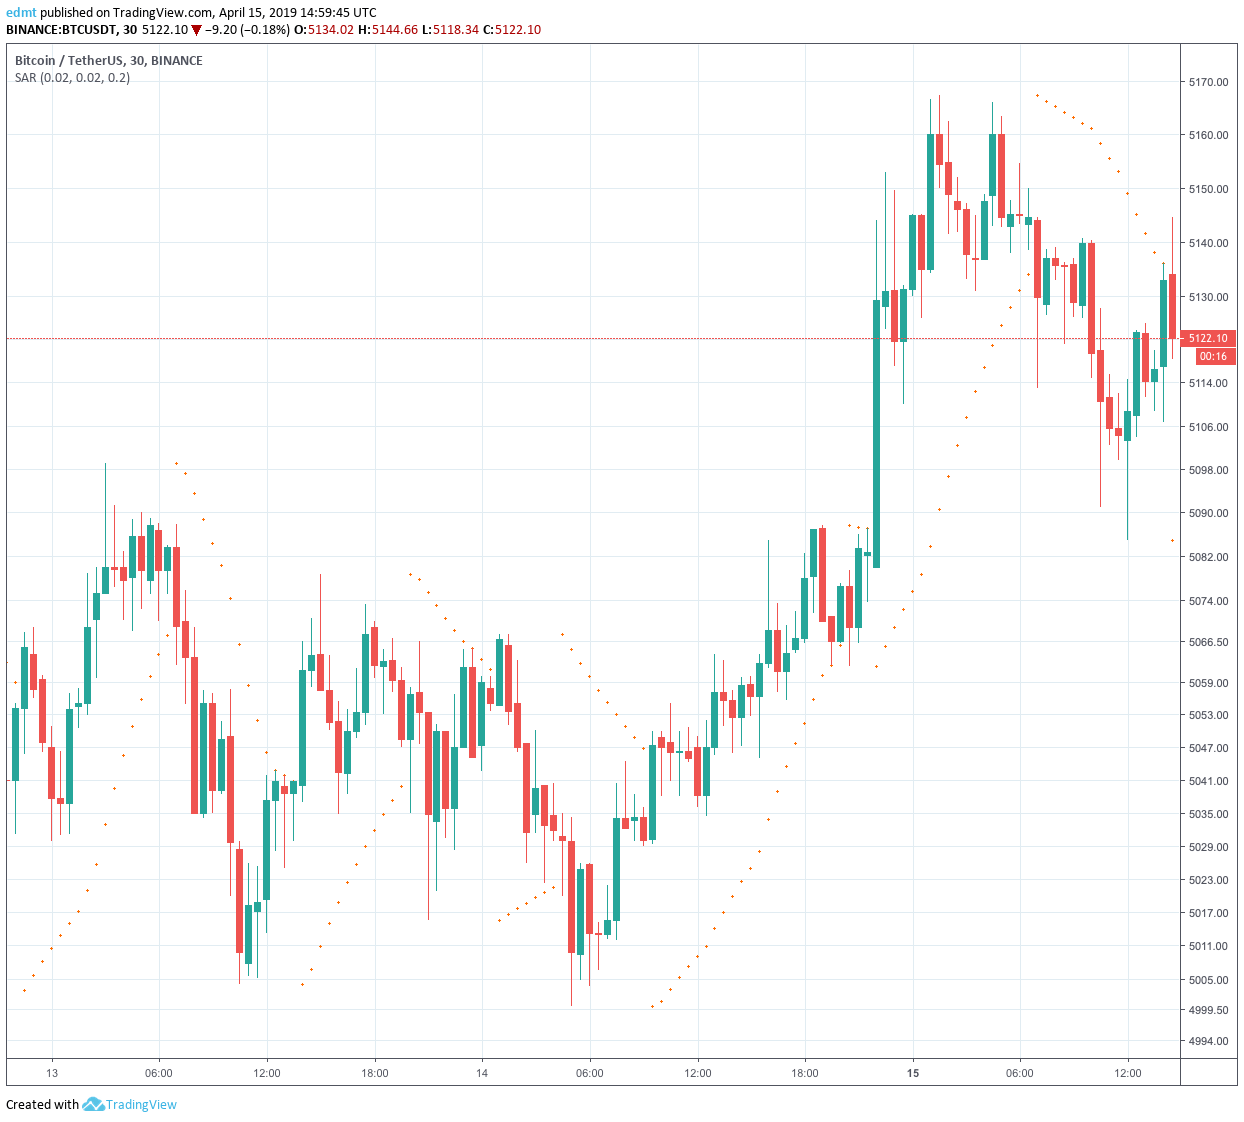
Parabolic Stop and Reverse (PSAR) is depicted as a series of dots either below or above the price bars. When the falling price reaches rising dots, then they move above the price bars and vice versa. The values are calculated based on previous extreme values and acceleration factor. You may say there’s a bullish trend when the dots are below the candles. Dots above the cryptocurrency price bars are a sign of bearish tendencies. Be cautious, as in a sideways market this indicator may produce false signals. Use Parabolic SAR (e.g. for Bitcoin) in combination with other indicators to confirm the trend and enter a position.
DMI Indicator
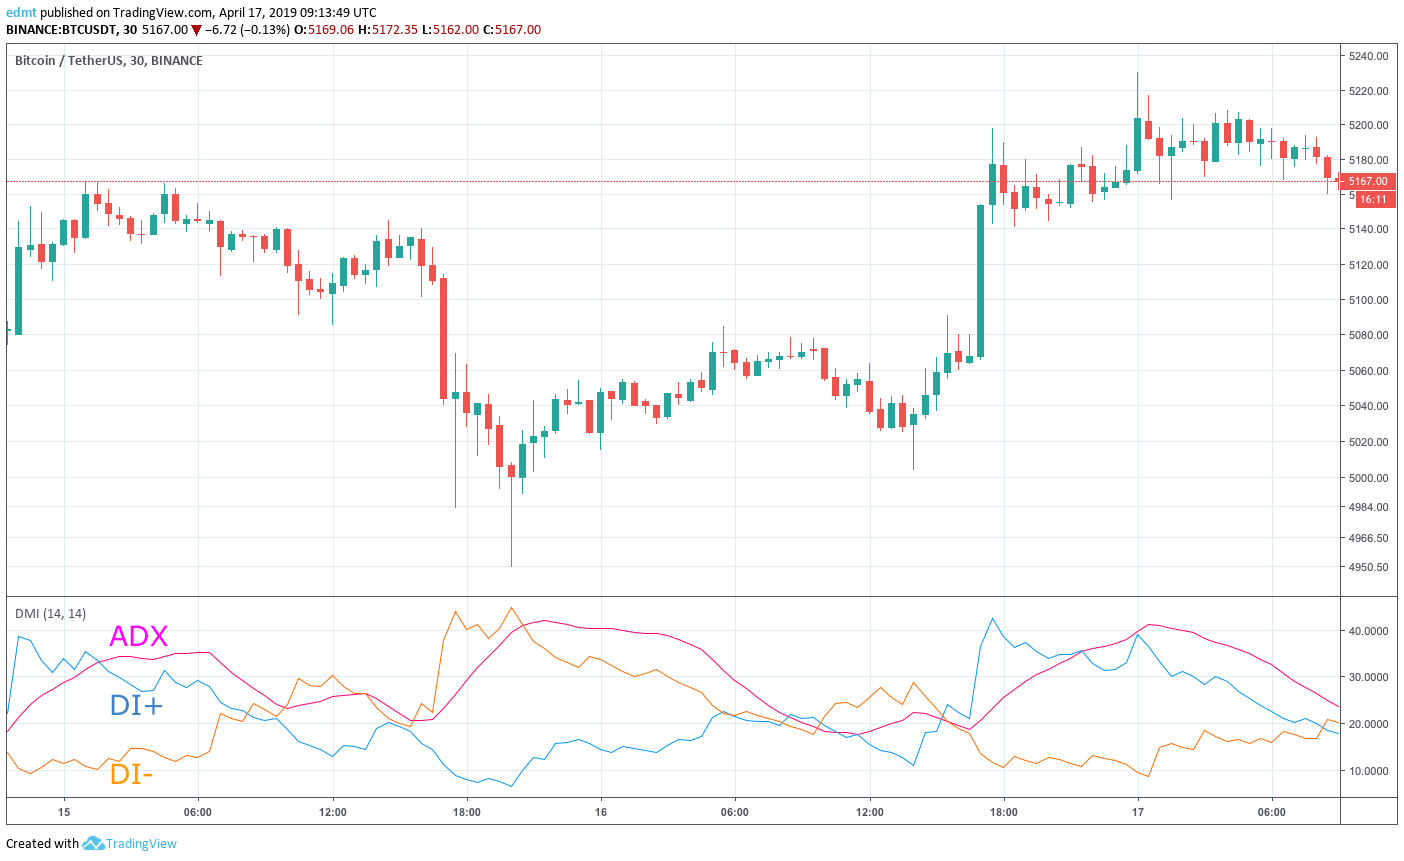
Directional Movement Index (DMI) indicator is calculated by comparing the asset’s highs and lows. It consists of two lines: a positive directional movement line (+DI ) and a negative directional movement line (-DI). The formulas for these lines won’t be touched upon in this article but in the core lies the idea of subtracting previous highs from current highs for +DI and previous lows from current lows for -DI. You may say there’s an uptrend if +DI is above -DI and vice versa. Crossovers are sometimes used as Buy and Sell signals.
By the way, DMI indicator is used to calculate Average Directional Movement Index (ADX) that is used to show trend’s strength. If the ADX line reaches 25 points, you may say there’s a strong trend in the market.
Here we covered the most important indicators that will help you spot a trend of cryptocurrency price. To get the most out of technical indicators, trend indicators, combine them with volume and momentum indicators to confirm the trend and enter the position at the best moment with minimal risks. Once you’ve confirmed a trend of crypto, you can automate your crypto trading by setting up a long or short bots with TradeSanta.
FAQ
What are trend indicators?
Trend indicators are used to define whether there price of a traditional or crypto asset is steadily heading in a particular direction or the price movements occur without any particular trend.
What are Simple Moving Averages?
Simple Moving Averages (SMA) may help a trader to spot a trend. To do that, plot on a chart two moving averages – long-term and short-term ones (traders usually combine MA of 200 and 50 or 50 and 15 periods).
What is Parabolic SAR?
Parabolic Stop and Reverse (PSAR) is depicted as a series of dots either below or above the price bars.
