Loads of trading strategies have emerged over the past decades but they always revolve around the simple idea buy low sell high. But how to spot the best moment to open a position? That’s the main theme of our today’s article.
Crypto market is way more volatile compared to traditional markets which means there are also more opportunities to gain on the price swings. But to make profit on volatile crypto market you should choose entry points wisely. Traders usually base their moves on either chart analysis or news events (regulation, hacks, cryptocurrency bans, forks, etc.) that may trigger price jumps or drops. The chance of a successful trade is the highest when technical analysis indicators meet the trigger events. If the price movements in case of news events are nearly intuitive, looking at the charts is not so much. Let’s lay down the most common indicators that may help to spot an entry point.
In this article we will review an indicator of each type: Trend indicator (MACD), Momentum indicator (RSI), Volatility indicator (Bollinger Bands) and Volume indicator (OBV). Technical indicators are not limited to the ones mentioned in the article, but we hope it will give you a comprehensive picture on how to catch a moment to open a position.
Trend indicator – MACD
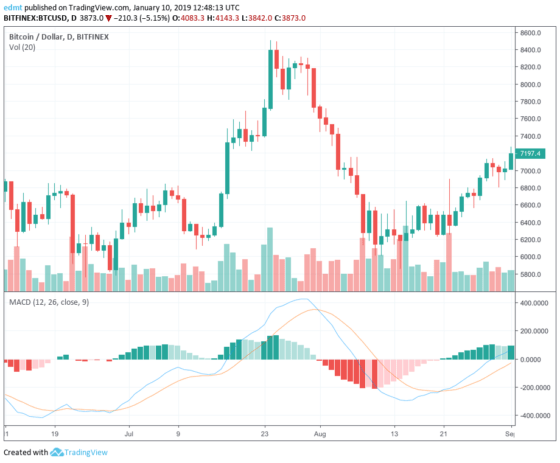
One way to confirm the trend is MACD – Moving Average Convergence Divergence indicator which is composed of MACD line (26-period exponential moving average (EMA) subtracted from a 12-period EMA) and a signal line (9 day EMA). MACD is often represented as a histogram and serves for traders to estimate how strong the trend is. When the MACD crosses the signal from above it is a signal for traders to buy and vice versa.
Momentum indicator – RSI
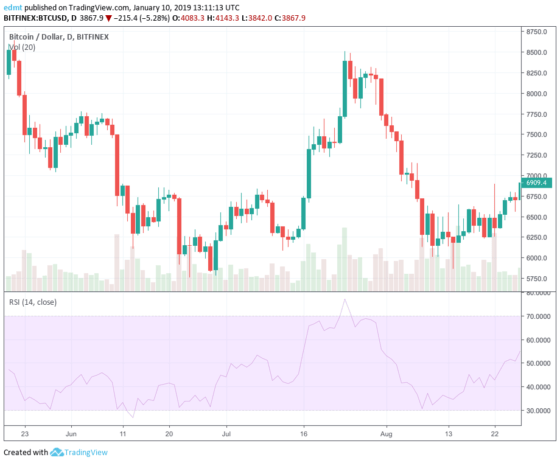
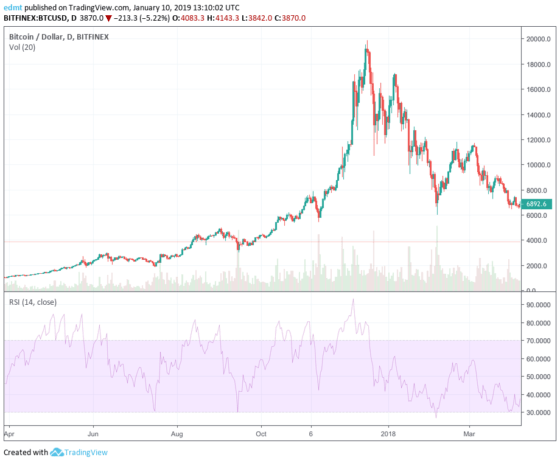
Another indicator that may come handy in spotting an entry point is Relative Strength Index (RSI) calculated using Average number of periods closed up and down. The value of RSI ranges from 0 to 100 with 30 being a signal that a stock is oversold and 70 that it’s overbought. The closer the returned value is to 0 or 100, the stronger turnaround in price will be. You shouldn’t forget that for volatile crypto market RSI used solely is merely enough. If you’d relied on RSI In the bullish run of 2017 you probably wouldn’t have entered the market since RSI signaled it to be overbought.
Volatility indicator – Bollinger Band
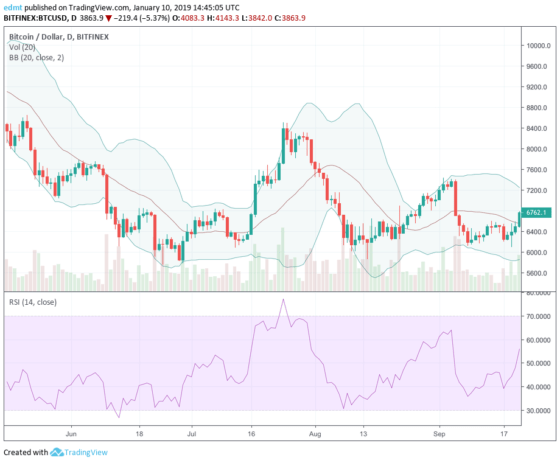
A lot of traders use Bollinger Bands to spot an entry point combined together with other indicators. Bollinger band is a chart compounded of two lines that lie a standard deviation away (positively and negatively) from a moving average line. The price crossing the lower band is considered a buying signal and vice versa but it’s best used when combined with other indicators such as RSI.
Volume indicator – OBV
On Balance Volume (OBV) is an indicator calculated as total of volume and graphically represented as a line. The indicator adds the trading volume if the previous period closed positive and subtracts the volume if the day closed negative. OBV can confirm price trends and indicate future price reversals. If the prices fall while OBV rises it can foreshadow a price increase and may vice versa. Also, OBV moving along with price serves as trend confirmation.
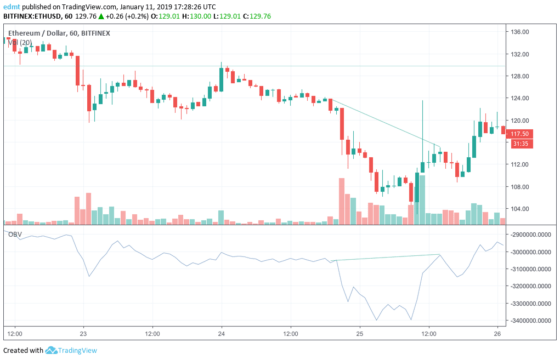
One last thing left to mention is that the best moment to buy is when several indicators point to a strong trend. Once you spot an entry point don’t forget to turn on your Santa bot that will execute the strategy you’ve set and deliver the results according to your settings.
As all of you know, the right exit time is almost as important as the entry point. In the next article we’ll cover the exit strategies and signals.
FAQ
How does TradeSanta’s bot spot an entry point?
TradeSanta’s bot uses technical analysis indicators, such as MACD, RSI, Bollinger Bands, OBV, to spot an entry point.
