What are candlestick charts?
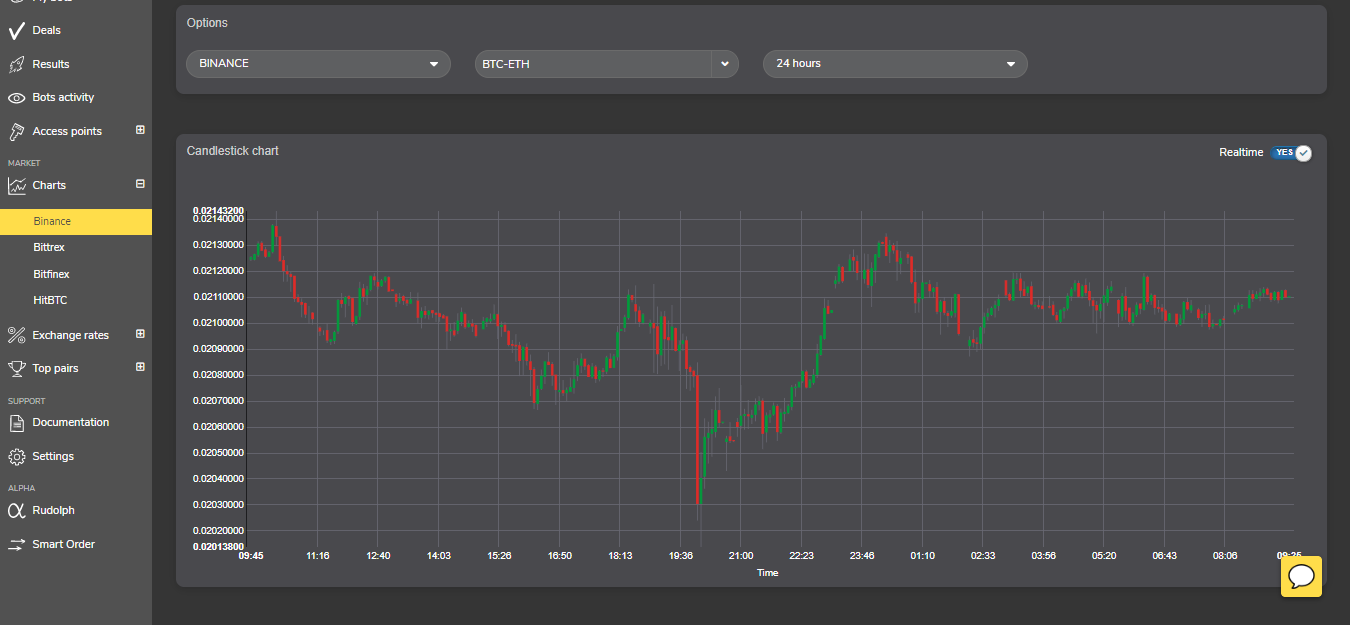
Candlestick charts follow the course of the pairs (price fluctuations) with a five minute step for the past 6h/12h/24h/2d/4d/1w.
Candlestick charts follow the course of the pairs (price fluctuations) with a five minute step for the past 6h/12h/24h/2d/4d/1w.