Here’s a simple yet useful guide on the Bollinger Bands indicator and all you need to know about it: the definition, the right settings, trading strategies and an explanation of how to implement them in different markets.
Before you proceed with this article, please note that as an indicator, the Bollinger Bands (BB) was developed to confirm signals given with other indicators, such as the Relative Strength Index (RSI), the Moving Average Convergence Divergence (MACD), or the On Balance Volume (OBV). Don’t try and do all of your trades based solely on the signals sent to you by BB, use it only in conjunction with other technical tools. Also, know that depending on the market, some signals sent by this indicator are useful, and some are not. In a flat market, compared to a trending market that moves up and down, the approach to using Bollinger Bands would be different. We’ll cover this part later in this piece.
What is the Bollinger Bands indicator?
One of the most used and time-proven indicators, Bollinger Bands (BB) is a technical analysis tool tailored to measure an asset’s volatility – the metric worth your attention with any market, but, of course, with crypto especially. The BB indicator consists of three lines: a simple moving average (SMA) in the center and two standard deviation lines above and below the SMA. Two standard deviation lines create an envelope that shows a volatility range in which a particular security price is moving up or down.
Just take a look at the picture below for visual clarity, we’ll explain the settings used in a bit.
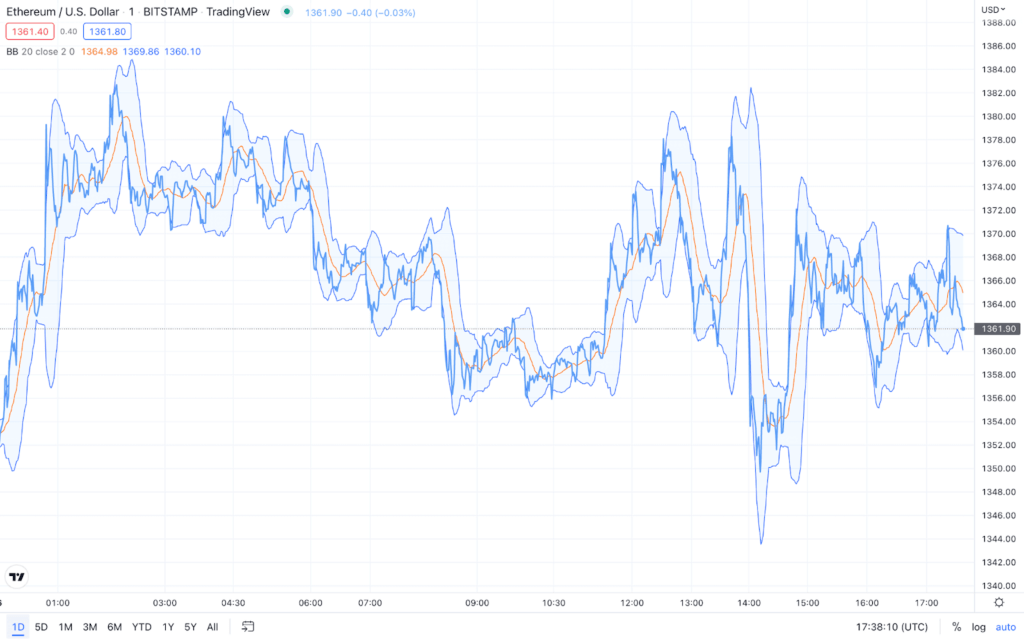
According to Bollinger himself, who presents his indicator every now and then at different events, you can use any time frame with this technical tool – a one-minute time frame, a one-day time frame (Bollinger’s favorite) or else. All you need for this indicator to work properly is a sufficient amount of liquidity during the time frame that the bar is forming. Meaning, the supply-demand relationship must be in place. Other than that, there are no limitations for using BB.
When customizing the Bollinger Bands indicator, you will have to set up a period and standard deviation parameters. The most common ones are 20 for a period, as in a 20-day simple moving average, and 2 for standard deviations.
Bollinger himself says that you should start with the defaults of 20-day SMA and 2 for standard deviation and adjust them only if you need it for your trading style, as these settings work really well.
So, how can you read and interpret Bollinger Bands indicator? Let’s discuss.
Reading Bollinger Bands indicator
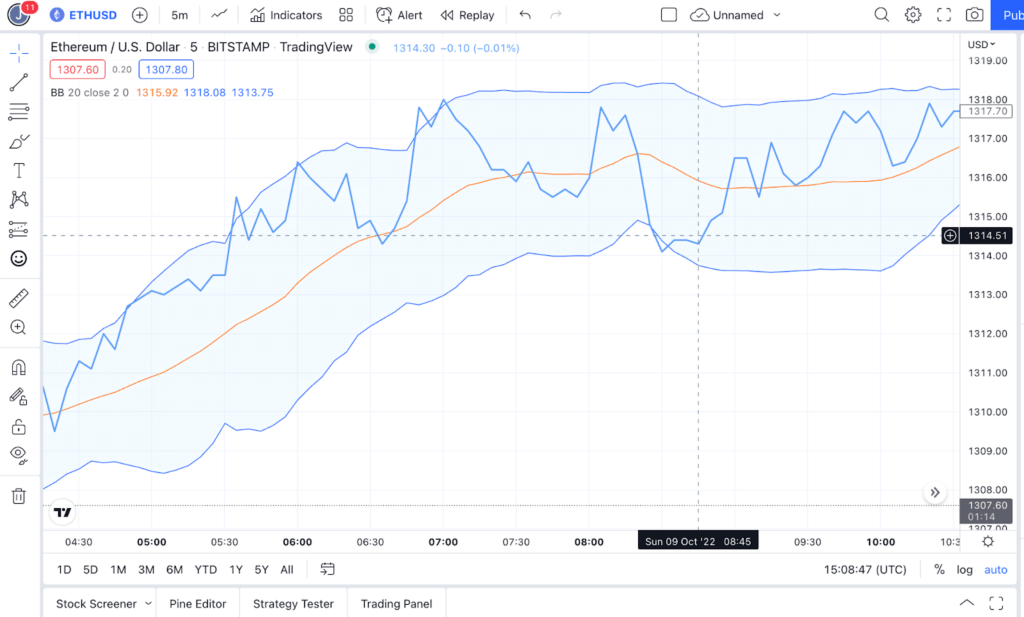
On this one-day chart above, the price (bold blue line) is trending above the SMA (yellow line), which is a sign of a potential positive continuation.
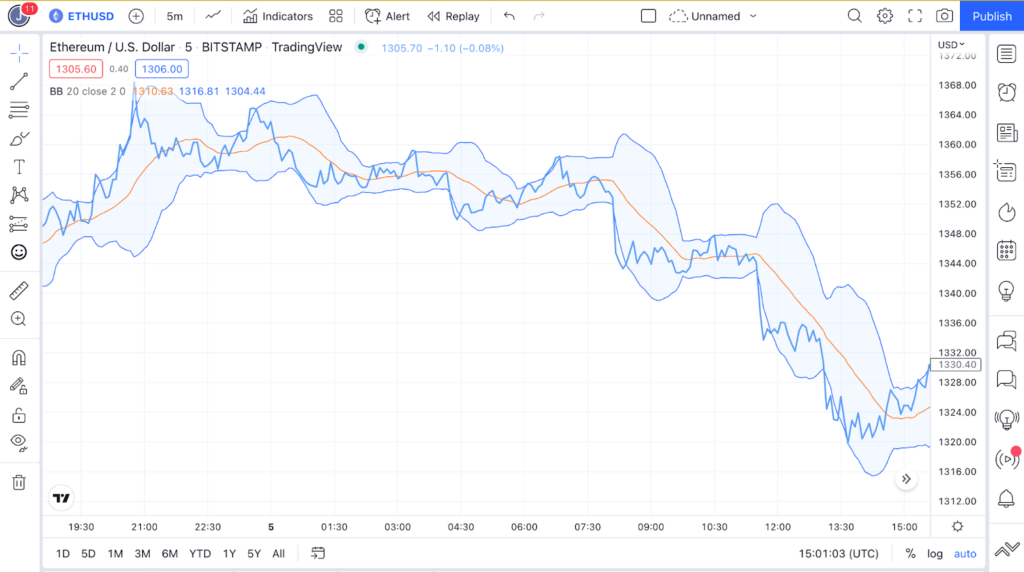
On this next chart, we can see that the price dropped below the SMA and at certain points even lower than the lower band. That is a sign of a potential negative trend.
The case in point is that, when looking at the Bollinger Bands indicator, it is providing you with a couple of useful details. First, a sense of a short-term market trend because of the 20-period SMA (the middle line). Also, when looking at the envelope formed, you can indicate the level of volatility in the market. The BB squeeze is a pattern on the chart formed as a result of low volatility. On the contrary, if the volatility is very high, the range expands, and that also gives you a visual representation of the current market sentiment.
Now, here comes a slightly tricky part. How do you read the Bollinger Bands indicator in different markets?
Flat Market
First thing, let’s deal with what it means when somebody says that the market is flat. A flat market occurs when a market is in neither an uptrend nor a downtrend, and the assets in a flat market are relatively constant in price, at least for a certain period of time.
It might be also called a sideways market or a deer market and is sometimes associated with low trading volume.
A flat market will contract the Bollinger Bands since volatility is relatively low.

Now, it’s important: when in the flat market the price jumps up and down within the range of support and resistance levels, buy and sell signals sent to you by Bollinger Bands don’t necessarily indicate the change of trend. It’s just a normal volatility within a range.
Let’s take a look at what’s happening in the trending market.
Trending Market
A trending market occurs when a price series continually closes either higher or lower over a number of periods. In case of a negative trend (descending trend), the price makes consistent new lower highs and lower lows. In case of a positive trend (ascending trend), the price makes consistent new higher highs and higher lows.
A trending market will widen the Bollinger Bands indicator since the volatility is much higher than with the flat market.
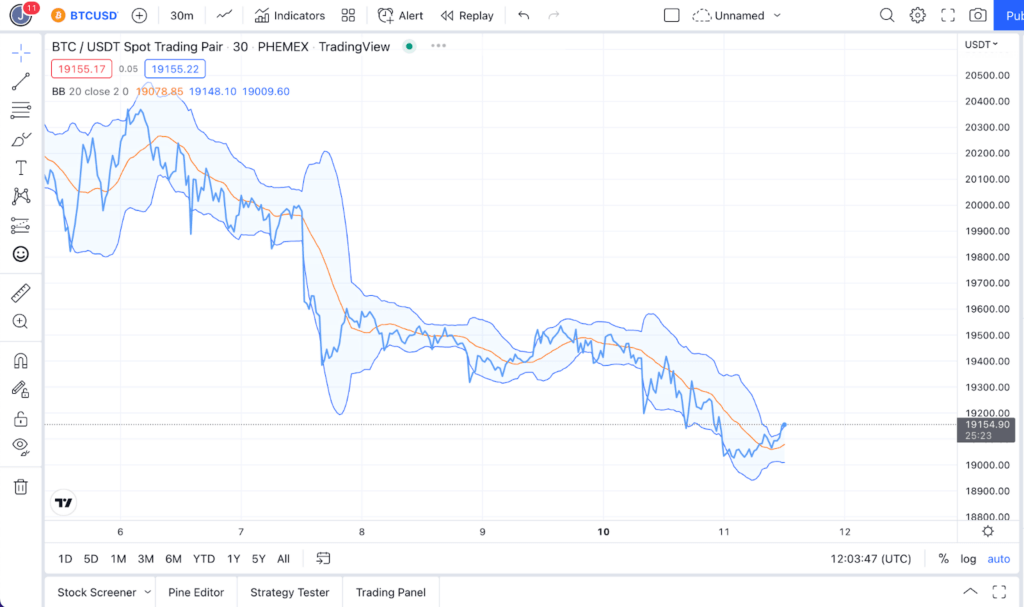
If you’re looking to confirm a new trend or its breakout, the signals sent to you by BB during this period of time might be vital.
In the trending markets, the BB indicator sends a signal when the price crosses an upper or lower band. For example, TradeSanta’s bots can listen to the BB indicator and act in accordance with its signals. The bot will start the sell trade when price crosses the upper Bollinger Band, and the long bot will start the buy deal when the price crosses the lower Bollinger Bands.
Nick Ranga, a senior cryptocurrency analyst for AskTraders.com, says that one significant drawback of BB is that in very volatile markets it can produce a lot of false signals, as can many indicators.
“Using a second indicator to confirm entry and exit points is a good idea,” Ranga says, ”indicators like the RSI can be used to determine the optimal times to enter and exit trades.”
In the trending market, when the price reaches the upper band, the asset is considered overbought. When the price approaches the lower band, it is considered oversold.
Patterns to use with Bollinger Bands
While analyzing the Bollinger Bands indicator, you might want to use various W and M patterns within the envelope the bands form – to identify a potential reversal. Let’s take a look at a few cases.
W Bottom Pattern
If a double bottom has a ‘W’ shape, it is a signal for a potential bullish price movement.
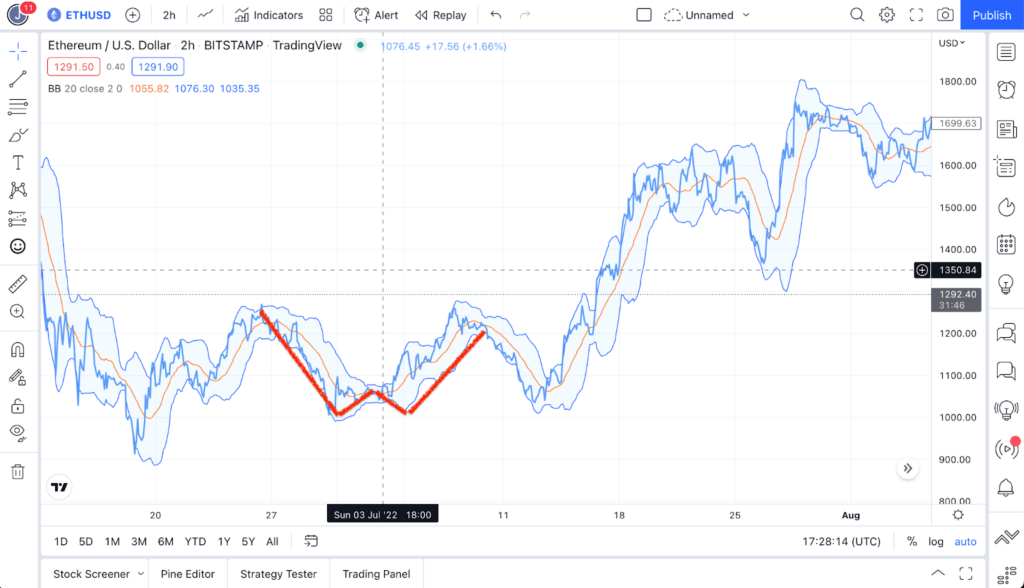
A W-shaped pattern typically occurs at the end of an extended bearish trend and indicates a potential bullish reversal which provides an opportunity for investors to obtain profits from a bullish rally. After a double bottom, common trading strategies include long positions.
M Bottom Pattern
If a double top has an ‘M’ shape, it indicates a potential bearish reversal in trend.
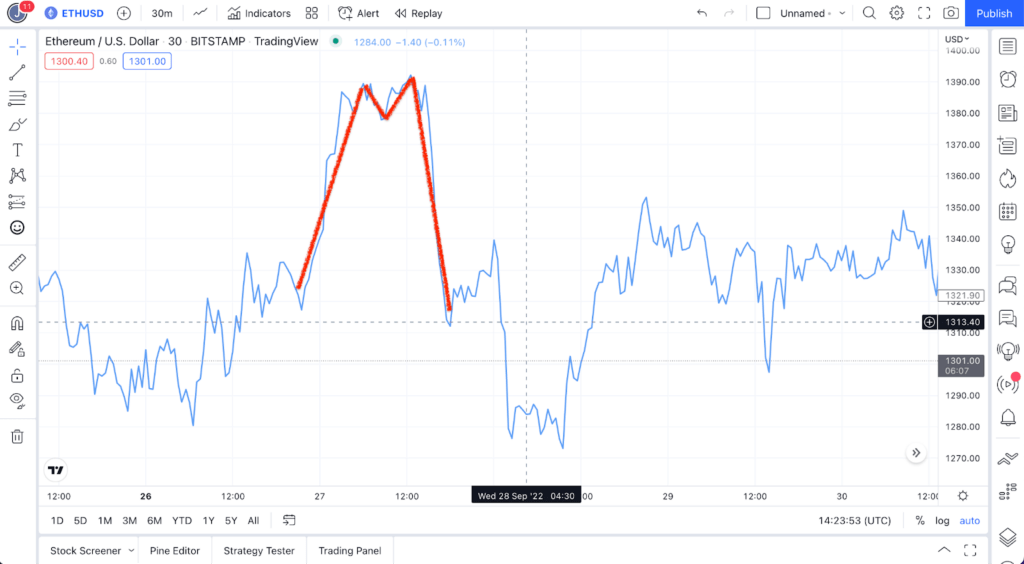
An M-shaped pattern typically occurs at the end of an extended bullish trend and indicates a potential bearish reversal. It can be a rare occurrence and it often indicates that investors are seeking to obtain final profits from a bullish trend. Double tops often lead to a bearish reversal in which traders can profit from selling the asset on a downtrend.
Bollinger Bands’s Trading Strategies
Trading the range with BB
Trading the range (in the flat markets) with Bollinger Bands is popular among scalpers, traders who profit off small price changes. This approach is good to go with on short-term time frames. Many scalpers, though, advise to take profits when the price has touched the SMA instead of waiting for the complete opposite edge.
Trading breakouts
Breakout is a situation where an asset moves outside a defined support or resistance level with increased volume. You might want to enter a long position after the price breaks above resistance or a short position after the stock breaks below support.
It’s possible to predict the breakouts based on the preceding squeeze that is forming on the chart. However, a squeeze is, of course, not always a guarantee that the breakout will happen. It’s strongly recommended to identify a breakout when at least 3 candles in a row have closed above or below the Bollinger Band.
While commenting for TradeSanta, CoinStats’ CEO Narek Gevorgyan said that Bollinger Bands work wonderfully in two scenarios: “Range-bound markets and slow trends. When it comes to range-bound markets, BB is fairly accurate, and can show when the price will reverse. When it comes to slow trends, BBs are decent as well due to the fact that they rely on the price deviation from the mean, and slow markets give time for people to adapt to prices. However, they are fairly inaccurate and possibly misleading in strong trends, as they can’t predict the FOMO or FUD which makes people overbuy or oversell significantly.”
Conclusion
Bollinger Bands (BB) is a technical analysis tool that was tailored to measure an asset’s volatility. In order to use it for placing buy and sell orders it’s essential to confirm signals with other indicators, such as Relative Strength Index (RSI), the Moving Average Convergence Divergence (MACD), or the On Balance Volume (OBV).
“I would use the RSI with the Bollinger band as they work well together to predict volatility and figure out when to buy or sell, ” says Jake Marmulstein, a casual trader and a CEO of Groundbreaker, “If you are trading long and see that the price moved below the lower Bollinger Band, you can look at the RSI for confirmation. If the RSI is not in the oversold area, it is possible that the price will keep falling. If the RSI is at the oversold level, we can use that as an entry point.”
When the price of the asset trends above the SMA, it is a sign of a potential positive continuation. When, on the other hand, the price trends below the SMA, that is a sign of a potential negative trend. A flat market will the Bollinger Bands since volatility is relatively low. A trending market will widen BB since the volatility is much higher than with the flat market.
A good-to-go trading strategy with this tool is to use various W and M patterns within the envelope – to identify a potential reversal. Scalpers also often use BB in a range (flat) market. When trading a breakout, you might want to enter a long position after the price breaks above resistance or a short position after the stock breaks below support.
Shoot all the questions here: Facebook, Telegram, Twitter!
FAQ
What do Bollinger Bands indicate?
Bollinger Bands (BB) is a technical analysis tool tailored to measure an asset’s volatility – the metric worth your attention with any market, but, of course, with crypto especially.
Is Bollinger Bands a good indicator?
According to Bollinger himself, who presents his indicator every now and then at different events, you can use any time frame with this technical tool – a one-minute time frame, a one-day time frame (Bollinger’s favorite) or else. All you need for this indicator to work properly is a sufficient amount of liquidity during the time frame that the bar is forming. So – yes, it’s a good indicator.
What are three lines in Bollinger Bands?
The BB indicator consists of three lines: a simple moving average (SMA) in the center and two standard deviation lines above and below the SMA. Two standard deviation lines create an envelope that shows a volatility range in which a particular security price is moving up or down.
